
Create a microsite
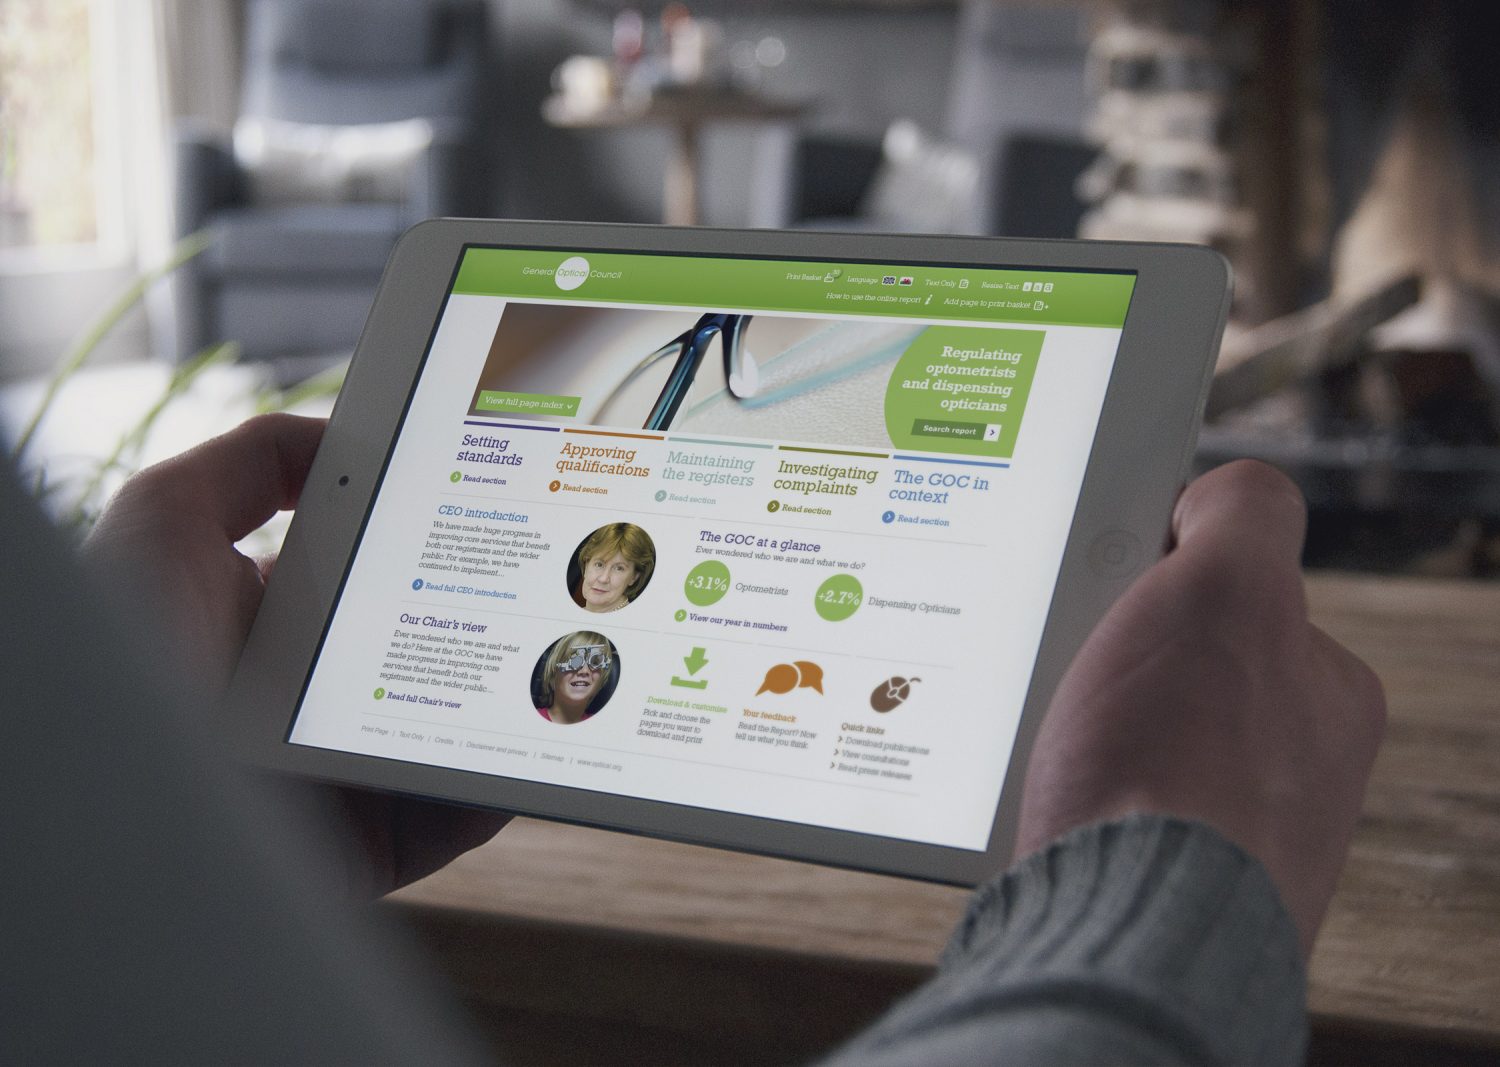
A microsite is an alternative way to create an annual report. A site allows you to organise the information in various ways. You may have each chapter as a separate page to make it easier to digest and navigate, and graphs and tables may be interactive allowing the user to specify the statistics they want to see.
What’s better is you can make the content searchable allowing the viewer to find the bits of information they want. The site can also be trackable. Using analytics can help you see what people are reading and what they’re clicking, allowing you provide more information on what people are really interested in or even be able to contact those readers directly.

Let’s not forget about print
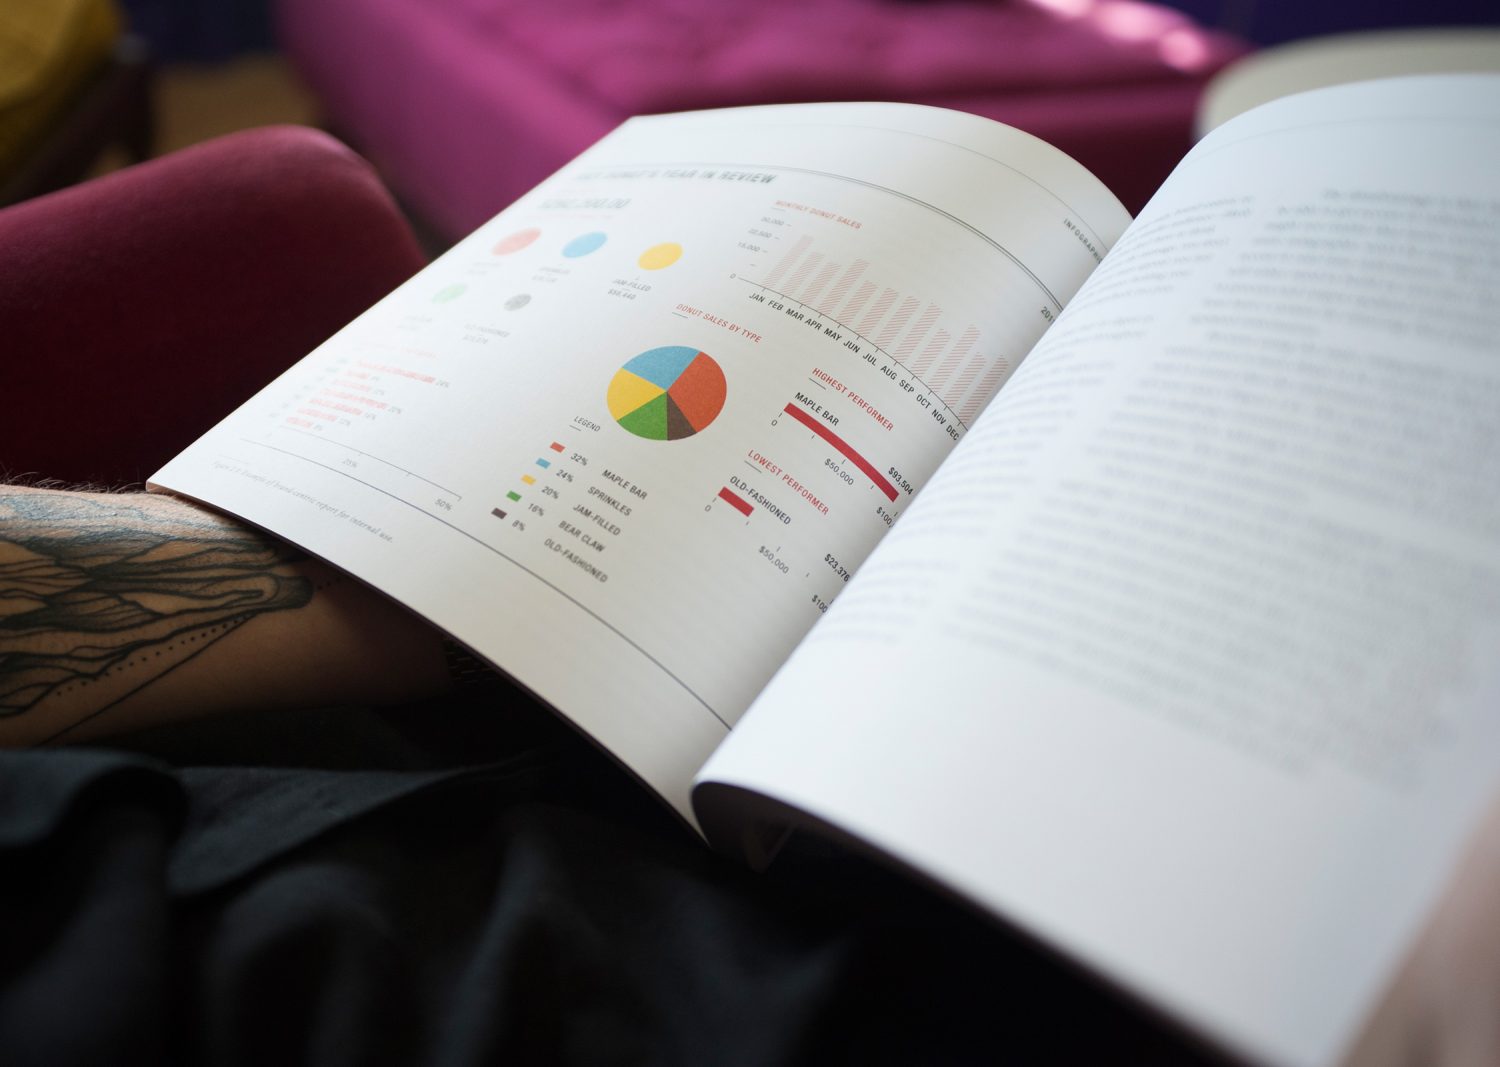
A report doesn’t have to be a standard document. There are lots of things you can do to elevate that printed piece. It doesn’t just have to be pages and pages of tables. We can display information in a number of ways.
Infographics are a great way to display information in an engaging way. Pulling out key stats and illustrating them can also work wonders!
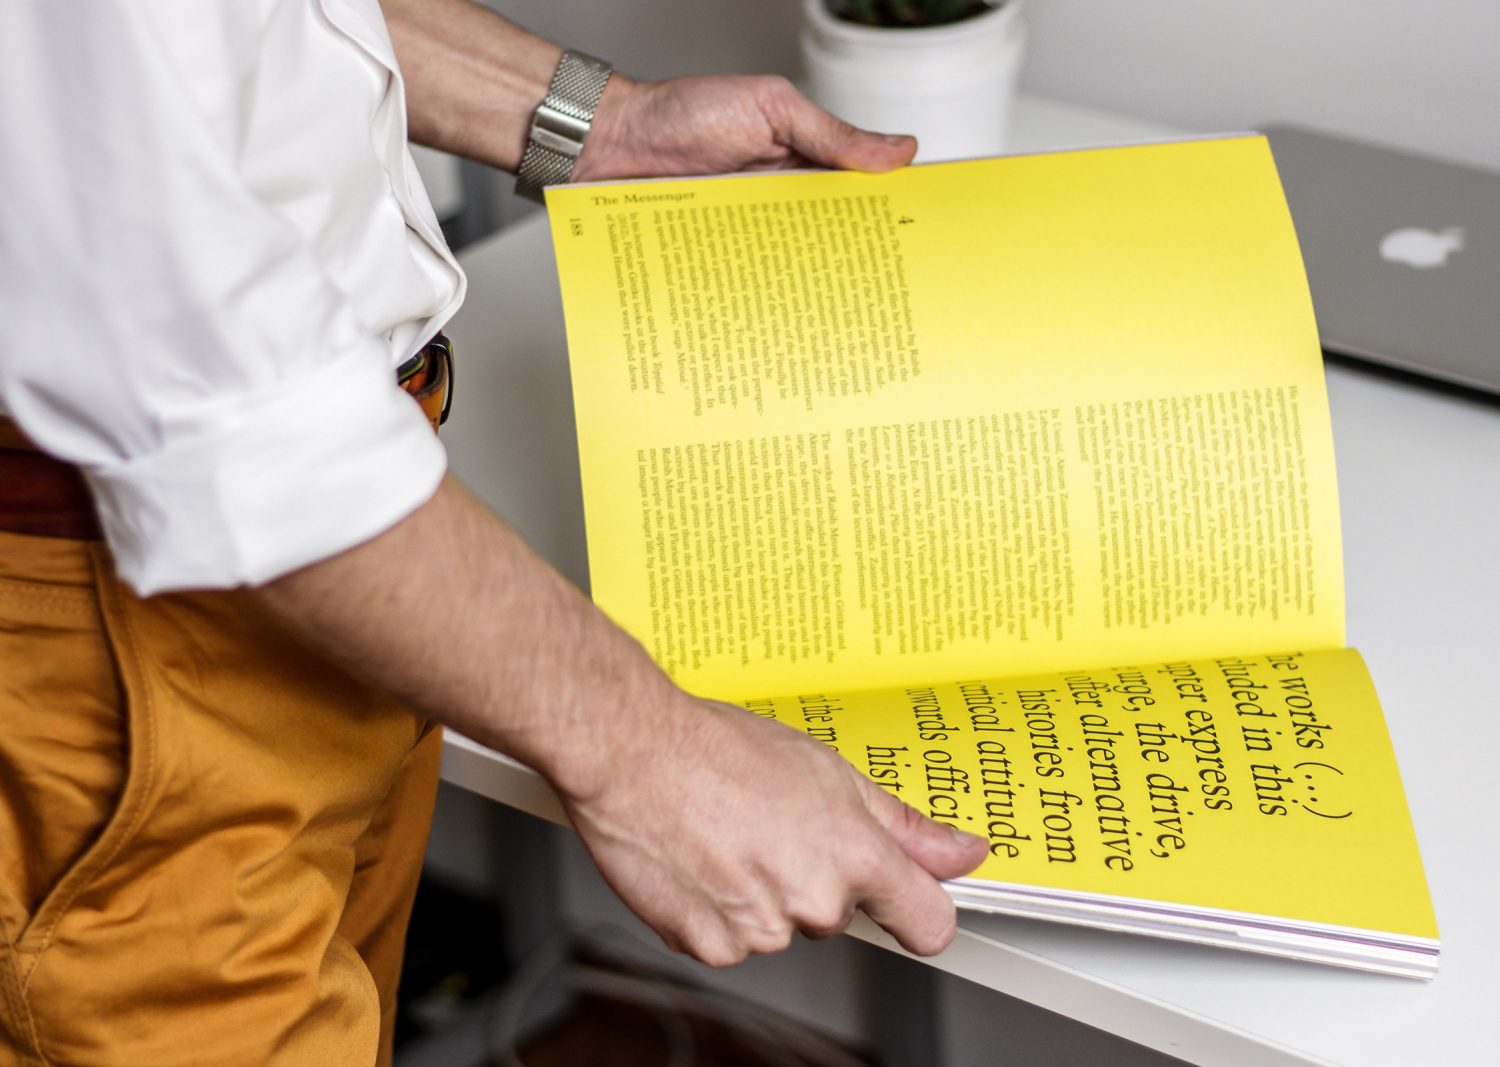
Size and finish
A printed annual report doesn’t have to be just A4 either. Alternative sizes could be used which doesn’t always mean extra costs. It’s all about being economical with the sheet size!
Special finishes can give personality whether it’s a metallic colour, a spot uv on a pattern, a clear foil or even a die cut on the cover. Give people an excuse to want to pick the report up. Who doesn’t love the smell of a freshly printed book?
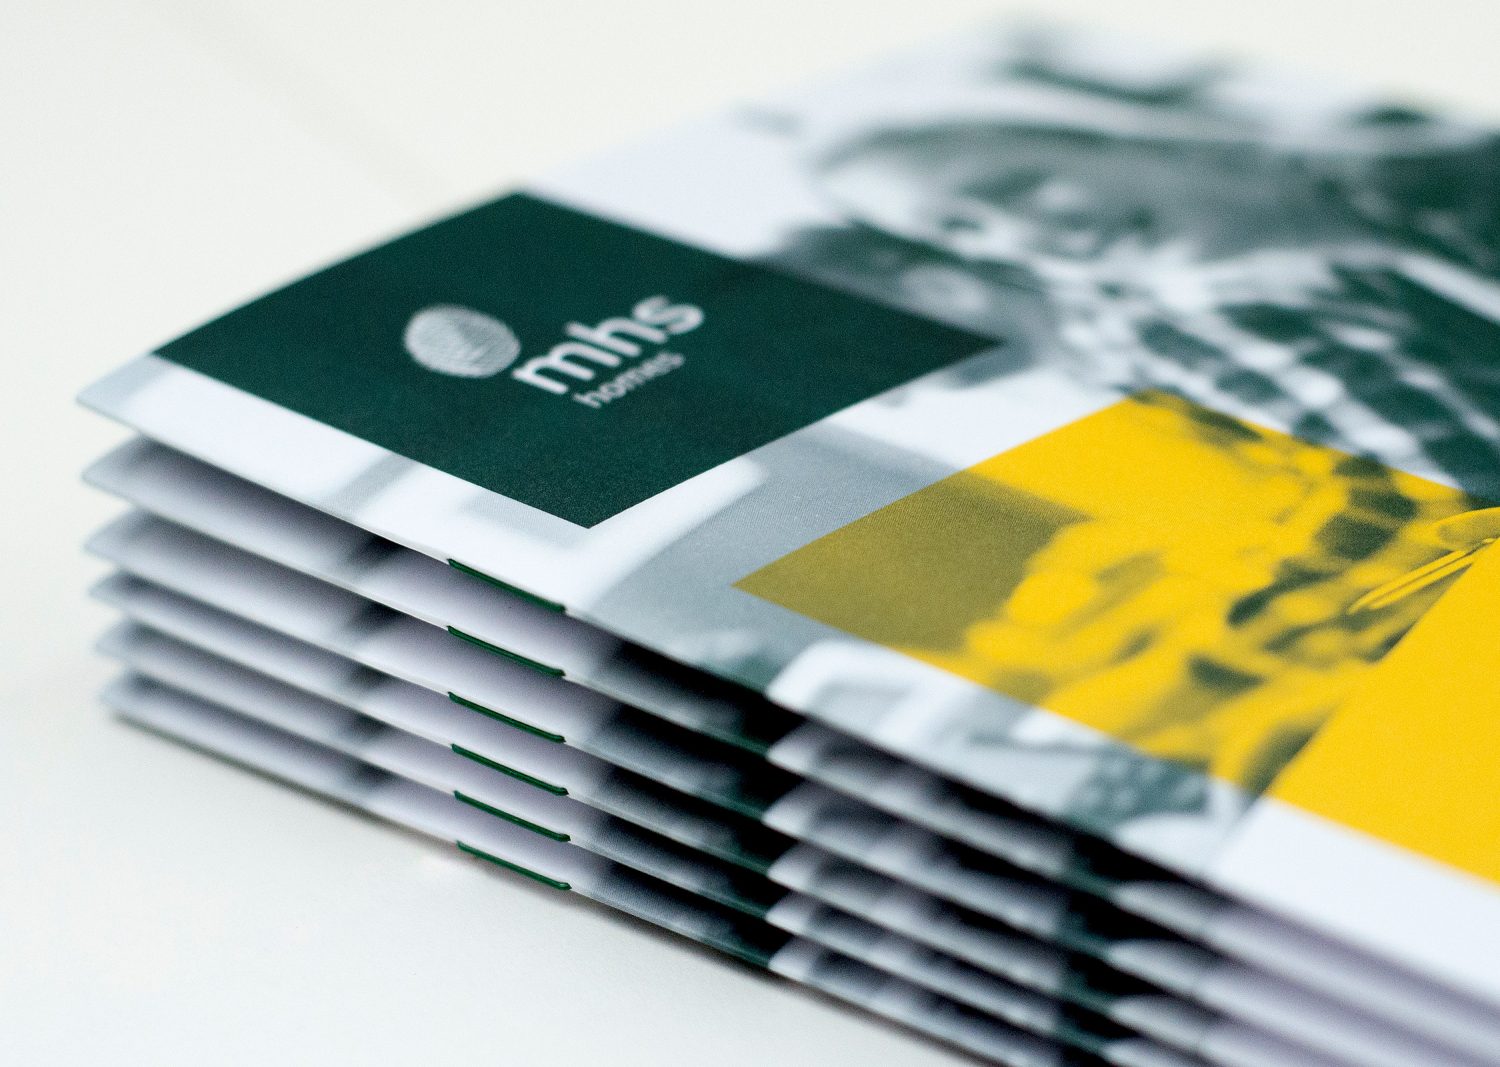
How your report is bound
You don’t just have to saddle stitch your report. Why not get creative with how the document is bound together to create an extra element and get away from the norm.
You can use screws or rivets to bind your book, which can give an industrial or architectural feel. A rivet in one corner creates a different way of opening the publication, almost like a Pantone Book. French folding allows you to add extra messaging within the inner pages, perhaps brand elements, secret messages, flashes of colour or inspirational quotes. Tape binding can allow you to add a bright splash of colour or additional texture to the cover enticing the reader in. Or even a simple touch such as a loop stitch or a colour saddle stitch can you a little edge to a standard finish.